
Jump To...
What’s Inside?
Imagine driving a ship without a radar. How would driving aimlessly in the sea feel like?
That’s what a lot of people do when it comes to general data science and analysis. Often, they skip the Idea of doing it just because it seems too complex and, to be honest, boring.
Come on, staring at a bunch of numbers isn’t fun. But to succeed you have to (and that’s the bitter truth).
Luckily, when you start out you don’t need to track everything if you are just a micro or even a macro niche site.
In this article you are going to learn about 10 blog metrics and how to use them practically.
Let’s dive in.
#1 Pageviews
Pageview is one of the most basic blog metrics Google analytics has to offer.
Pageviews refers to the amount of time a user views any of your pages.
For example, a user comes to your website and then stumbles across one of your landing pages. Then he/she refreshes it 5 times, because of this your GA will report you 5 pageviews.
Why?
Because the User has viewed your landing page for 5 times that is equal to 5 pageviews.
It also has a notable alias, that is Unique pageviews. To explain it we have to go with the previous path again but alter it a bit.
Say, the user bookmarks your landing page’s URL for the future. After some he/she revisits. Now this time GA will report this visit as a 2nd session of your user on your website.
Now if the user again refreshes and views your content 5 times then yes it will count to 5 pageviews but as all this is happening in one session, GA will report only 1 unique pageview.
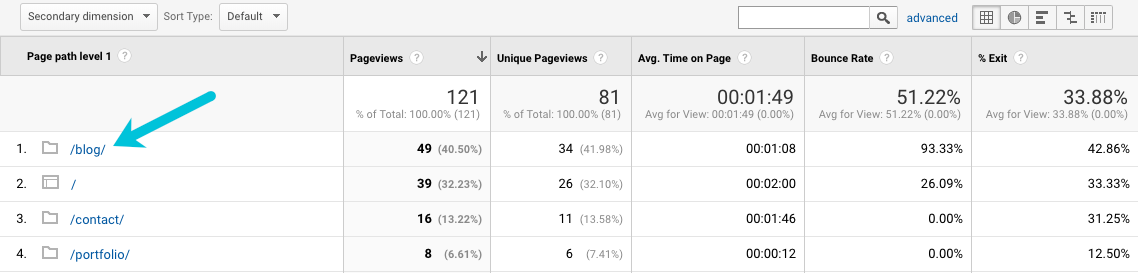
Pageviews are important to find underperforming or overperforming content on your blog.
Here’s the process to find them.

Or Behaviour > Site Content > Content Drill Down / All Pages.
After clicking that here’s how everything will look like,
#2 Time On Page
You might think that you have the best content out there or your content ticks off all the attributes in your “High-Quality content checklist”. But is it really so?
Because at the end of the day what matters is how users are interacting with your content. Are they sticking around till the end or are they just like “Meh I can find better content”.

The Time On Page metric will show you the truth. Oftentimes you will publish a blog post, prematurely accept that it’s great and then forget about it. Only to find out it just can’t rank because of the poor time on page.
Like the Pageviews metric the Time on page metric also resides on Behaviour > Site Content > All Pages / Content drilldown.

There can be a lot of reasons why your Time on page might be poor. A few of them are:
- the introduction is not enticing
- the headline was misleading
- the writing quality is poor
- there are too many distractions on the page
- the page loads too slowly
To get the most out of this metric you should use it with a Heatmap tool like Hotjar.

With Hotjar you can see how users are behaving & interacting with your content visually. All you have to do is export pages with poor time on page and then analyze their heatmaps and you will instantly see what turns them off.
#3 Returning Visitors
You can consider your returning visitors as your website’s super fans (if they aren’t bots). Don’t you go to your favourite restaurant or cafe once in a while?
If you can consistently write effective and top-notch content you are more likely to retain your first time unique visitors and gain authority & referrals in your space.
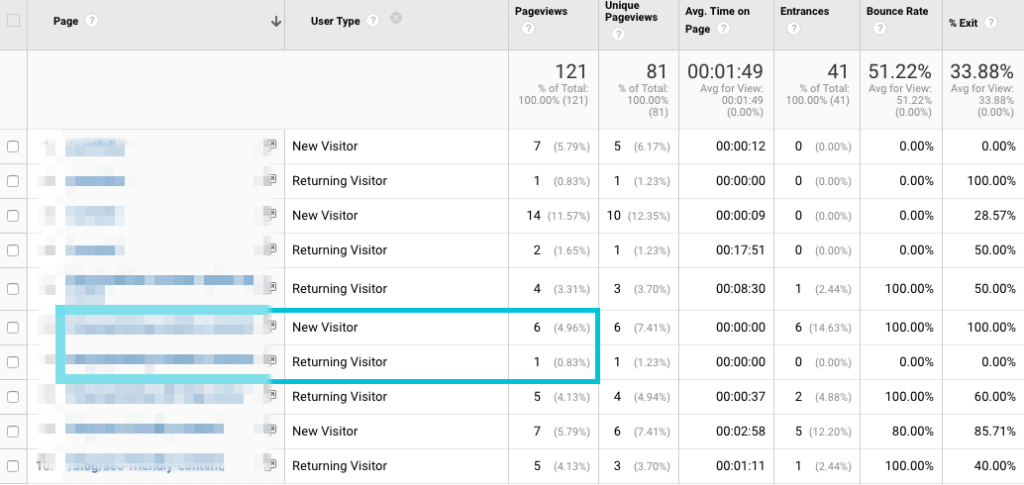
To check your returning visitors follow these steps,
- Go to Behaviour > Site Content > All Pages
- Click on the secondary dimension drop-down and select “User Type”.
- Then click on the Page header to stack the new & returning visitors version of all your pages.


This will add a new column to your report that will specify how many page views are coming from returning users and how many from first-time users.
#4 Bounce Rate
Bounce rate is a metric that simplifies or shows the % of users that bounce/exit your pages right after they click through to it. Bounce rate is a universal metric. That is it can be filtered on page level or on website level.
To check your websites overall bounce rate go to
Audience > Overview
There you will get an overview of all the key blog metrics like Total sessions, Users & bounce rate of your entire website.

To get more specific and check the bounce rate of specific pages follow this path
Behaviour > Site Content > All Pages

There you can check the bounce rate and correlate it with Time on-page to uncover valid arguments & reasons about why people are exiting so quickly.
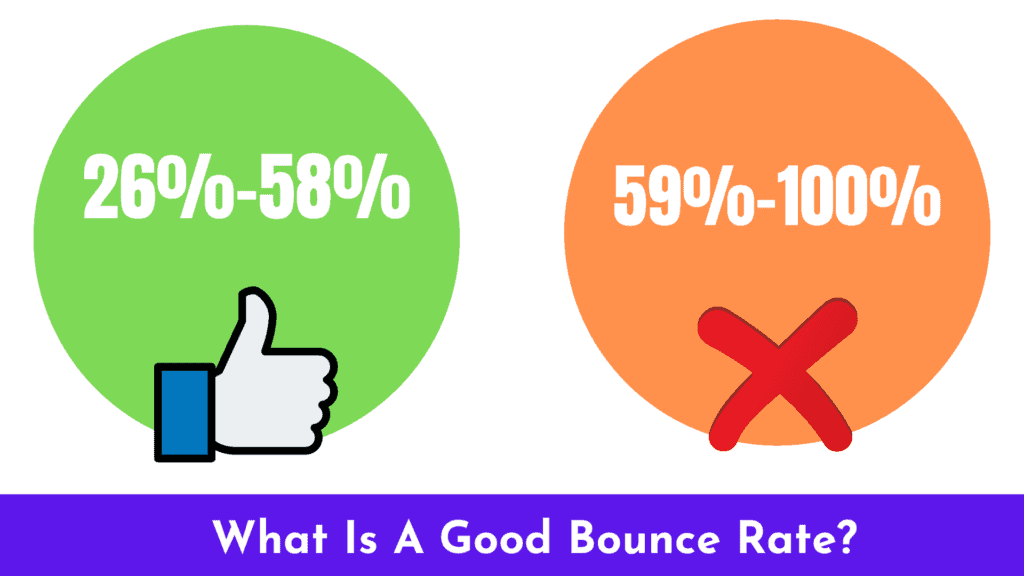
If your user has a time on page = 0:00 and a bounce rate of 100% then it is a bot
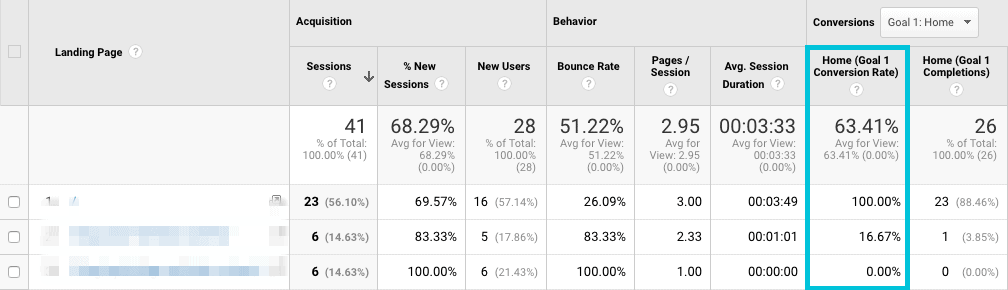
#5 Goal Conversion Rate

Goals measure the actions you want your users to make after reading one or more of your blog posts. For starters that might be newsletter signups, affiliate link clicks, gig sign ups etc.
A lot of people don’t track Goals in GA. And this is a very stupid mistake. The content you publish should ultimately contribute to your bottom line in the short or long term.
Goal Conversion Rate refers to the number of goal conversions divided by number of sessions times 100.
If you already have a goal setup then just go to this path (Behaviour > Site Content > Landing Pages)
With that said here are some top goals you should definitely track
- Newsletter Conversion rate
- Affiliate Page visits
- Lead Magnet signups
#6 Top Shared & Linked To Posts
If people link & share a specific post from your blog then you know it’s valuable and more highly *linkable*.
It is a well known fact that Links are crucial to rank high on google.

And not every piece of content you publish will have the potential to go viral and rack up hundreds or even thousands of links. So whenever you can you should track which one of your posts has the most links and then try and use only that specific one while outreach.
Also, if one of your articles has a ton of shares then you should consider placing it on your blog feed so that new readers can quickly read it and keep the share loop going on.
You can use the Google Search Console to find top linked content on your website or you can also use the AWT (Ahrefs Webmaster Tools) for it.
Just follow these paths
GSC: Home > Links
![[censor output image]](https://im7.ezgif.com/tmp/ezgif-7-b8c98cc519ef.png)
AWT: Dashboard > Site Explorer
#7 Traffic By Channel
Not all the traffic channels drive the same quality and quantity of traffic. And you as a marketer shouldn’t focus on all channels just for the sake of self-satisfaction.
We here at howtosuper believe in Growth Hacking & Rapid experimentation. And we would suggest you do the same.
For example, a few months ago we started a new website in the Ultra competitive “Tech” niche (That is a sub niche of tech). And we decided to market it using 4 channels at first, namely:-
- Quora
- YouTube
After 7 months we found out that the best working channel for us was Quora. Which was directly opposing our assumption of YouTube being the best one.
Now armed with data we decided to double down on Quora and reduce efforts from other channels. And the results speak for themselves.

Bottom line?
Track, measure and optimize your best traffic channels.
Follow this path to check your Traffic channels (Acquisition > All Traffic > Channels)

To check your traffic sources for a particular platform go to Acquisition > All Traffic > Source/Medium
There Google Analytics will stack all your traffic sources according to pre-defined channel categories.
To create a custom source use UTM builders. (aka URLs like x.com/utm?source=Quora&utm?medium=Social)
#8 Email Subscriber Growth/day
Email subscribers are the most faithful of your readers. Why? Because if they didn’t opt for your emails then you know they aren’t interested in hearing from you.
But the question is, wouldn’t you want more of these people?
Then you have to track your daily email subs growth. And the best way to track this metric is to use it as a bar to measure the impact of specific pages, changes or content of your email list.
I.e
“ I publish this content with this option form and I get 24% increase, So next time with this type of content I will make sure my lead magnet also get aligned ”
To check your Email subscriber growth / per day head over to your email service provider (Aweber,MailerLite,MailChimp,ConvertKit) and then go to subscribers.
Most probably there will be a graph showing you exactly that.
If you are wondering about some quick tips to grow your email list then check out this infographic we have lined up for you.

#9 CTR
CTR helps you determine whether your content is actually appealing to “Organic searchers” i.e if your content is the perfect match for search intent.
Search intent refers to the intent of a searcher when he/she googles a keyword. More on that here
There is also a catch. And that is not everyone gets a ton load of clicks or CTR. This is because often the top ranking or the #1 page, successfully fulfills all the conditions of Google to rank for that keyword.
And as a result everyone clicks through just to that particular page or article.

With that said here are some key things to keep in mind regarding CTR:
- Don’t go crazy about it. If you have a brand new website your CTR will range from 2.5% to 7%. And this is for your entire domain.
- CTR directly influences your rankings by triggering Google’s RankBrain.
- The best way to increase it is by modifying your title and description along with your content to match with the searcher’s intent.
#10 Link Velocity
As our blog is all made for noob’s or first time website owners, we are keeping this metric oriented for them.
See, google doesn’t like it when you have a sudden explosion of new backlinks if you are a new website. Think about it for a minute.
A new website comes up and nobody knows it, and then within 6 months it has 100,000 backlinks. Doesn’t it look spammy?

Yes it does.
That is sudden explosion of links = google penalty.
And to prevent our new websites from getting slapped with these stupid penalties, SEOs have come up with the idea of “Link Velocity”.
Basically, it means you should acquire backlinks at a certain rate according to your website’s age and authority.
So for a new website that maybe 7-10 links per day.
Image on thumb rule of link velocity.
You can track this metric with the help of Google search console or SEO tools like Mangools and SEMrush.
Wrapping Up
As mentioned in the introductory paragraph, blog metrics are very important for a successful blog growth plan. But this also doesn’t mean that you should end up in “Analysis Paralysis”.
Our advice would be to maintain a google doc with the uses and application of your key metrics so that a single glance on your analytics dashboard would be enough to tell you where you are going with your marketing.
These 10 blog metrics should be enough for you beginners.
So keep analyzing metrics and reading the howtosuper blog.
If you have any questions, ping us on twitter.
Adios!